Summary written by Dr. Gadi Borkow.
Statistical analysis performed by Dr. Gil Harari, MediStat Ltd. (www.medistat.co.il)
The effect of Cupron’s linens gradual deployment in 11 Sentara hospitals in reducing the total rate of hospital acquired infections (HAIs) was analyzed. The HAIs included were Clostridium difficile, gram negative multidrug resistant organisms (MDROs), MRSA and VRE infections. The period of data collection of HAIs and the time of Cupron linen deployment for each hospital is detailed in Table 1 below. The data of all hospitals was gathered and referred as a whole and the effect of percent intervention in all hospitals, i.e. Cupron’s linen deployment per all hospitals (Table 2), on the rates of the total HAIs per 1000 patient days (pd) was analyzed.
The statistical methods used were:
- Generalized Linear Model for Poisson distribution was applied for testing the statistical significance of the relation between the decrease in number of HAI/1000 patient days and the increase in percent of intervention.
- Generalized Linear Model for Poisson distribution was applied for testing the statistical significance of the decrease in number of HAI/1000 patient days over time (in months resolution).
Table 1: HAI Data Collection Period and Month of Cupron Linen Integration in each hospital
| Hospital Name | Data collected from – to | Cupron linens integration |
| SCH | January 2015 – December 2018 | January 2015 |
| SPAH | January 2013 – September 20161 | October 2015 |
| SVBGH | January 2013 – September 20162 | October 2015 |
| SNGH | January 2013 – April 20173 | October 2015 |
| SAMC | January 2013 – December 2018 | May 2017 |
| SWRMC | January 2013 – December 2018 | May 2017 |
| SOH | January 2013 – December 2018 | May 2017 |
| SRMH | January 2013 – December 2018 | May 2017 |
| SMJH | January 2015 – December 2018 | May 2017 |
| SNVMC | January 2015 – December 2018 | May 2017 |
| SHRH | January 2015 – December 2018 | May 2017 |
1 Antimicrobial hard surfaces were included on October 2016.
2 Antimicrobial hard surfaces were included on October 2016.
3 Antimicrobial hard surfaces were included on May 2017.
Table 2: Percent intervention
| Period | Percent Intervention |
| January 2013 – December 2014 | 0 |
| January 2015 – September 2015 | 9.09 |
| October 2015 – April 2017 | 49.49 |
| May 2017 – December 2018 | 100 |
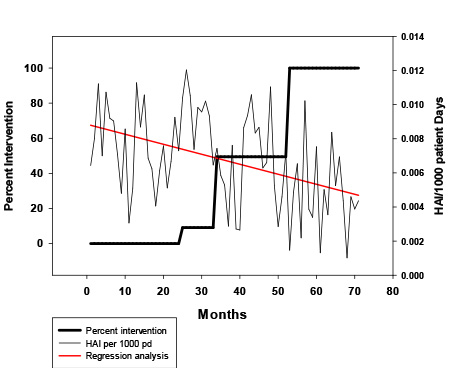
As can be seen in the Figure below, there was a decrease in the total number of HAIs/1000 patient days as the percent of intervention increased (regression red line).
As detailed in Table 3 and 4, there is a highly statistically significant relationship between the decrease in number of HAIs/1000 patient days and the increase in percent of intervention (p<0.0001), as well as the decrease in number of HAIs/1000 patient days over time (p=0.0003).
Table 3: Poisson regression on intervention
| Analysis of Maximum Likelihood Parameter Estimates | |||||||
| Parameter | DF | Estimate | Standard Error |
Wald 95% Confidence Limits | Wald Chi-Square | Pr > ChiSq | |
| Intercept | 1 | 2.0656 | 0.0568 | 1.9543 | 2.1770 | 1322.76 | <.0001 |
| Intervention | 1 | -0.0049 | 0.0012 | -0.0073 | -0.0025 | 15.61 | <.0001 |
Table 4: Poisson regression on month
| Analysis of Maximum Likelihood Parameter Estimates | |||||||
| Parameter | DF | Estimate | Standard Error |
Wald 95% Confidence Limits | Wald Chi-Square | Pr > ChiSq | |
| Intercept | 1 | 2.1944 | 0.0861 | 2.0256 | 2.3632 | 649.31 | <.0001 |
| Month | 1 | -0.0082 | 0.0022 | -0.0126 | -0.0038 | 13.28 | 0.0003 |
During the whole period studied, i.e. between January 2013 and December 2018, in all Sentara Hospitals, the HAI prevention interventions were similar and constant. The main change in the anti-infective measures was the introduction of Cupron’s antimicrobial linens and in a few hospitals also the later introduction of copper oxide impregnated antimicrobial hard surfaces. In order to preclude the potential effect of the antimicrobial hard surfaces on the reduction of HAIs, no data was included in the analyses from the periods when the antimicrobial hard surfaces were already used in the hospitals (see footnotes to Table 1).
Following the full implementation of the Cupron antimicrobial linens, there was a greater than 37% reduction in the HAIs rate as compared to the HAIs rate prior to the medical textiles intervention (Table 5). Although there may be other factors that have contributed to the reduction of HAIs over time in the hospitals studied, the data presented here strongly supports the notion that that there is a good relationship between the deployment of antimicrobial Cupron linens in hospitals and the reduction in the rates of HAIs.
Table 5. Mean HAI/1000 patient day per intervention period
| Percent Intervention | Months | HAI/1000 patient days
(x10-3) |
Percent Reduction from Intervention | P value (t-test) From Intervention | ||
|---|---|---|---|---|---|---|
| Previous | 0 | Previous | 0 | |||
| 0 | 24 | 7.5029 | NA | NA | NA | NA |
| 9.09 | 9 | 9.5326 | -27 | -27 | 0.02 | 0.02 |
| 49.49 | 19 | 6.5195 | 31.6 | 13.11 | 0.004 | 0.09 |
| 100 | 19 | 4.6708 | 28.36 | 37.75 | 0.03 | <0.001 |
NA- non applicable
Author: Dr. Gadi Borkow